AI for Excel: Turn 36 Monthly Columns into an Annual Report
Build an annual Excel report from 36 monthly columns with GetSheetAI. Real screenshots show yearly totals, profit margins, growth and formulas that update with the source.
Real screenshots from a local developer demo using simulated data, not customer records. The original app interface is preserved. Short videos include sped-up processing.
Your monthly report has grown sideways for three years. Now someone wants the annual view. The numbers are already there; the repetitive part is selecting each year, rebuilding the totals and treating percentage rows differently.
To summarize monthly data by year in Excel with AI, open GetSheetAI and ask for a new annual report linked to the original sheet with formulas. In this case, 36 monthly columns become three annual columns, with revenue, expenses, profit margins and year-on-year growth together.
The screenshots are from our actual Excel demonstration using a simulated office-supply business. They are not mockups or customer financial records. The Excel ribbon remains in the recording's original language; the workbook and instruction are in English.
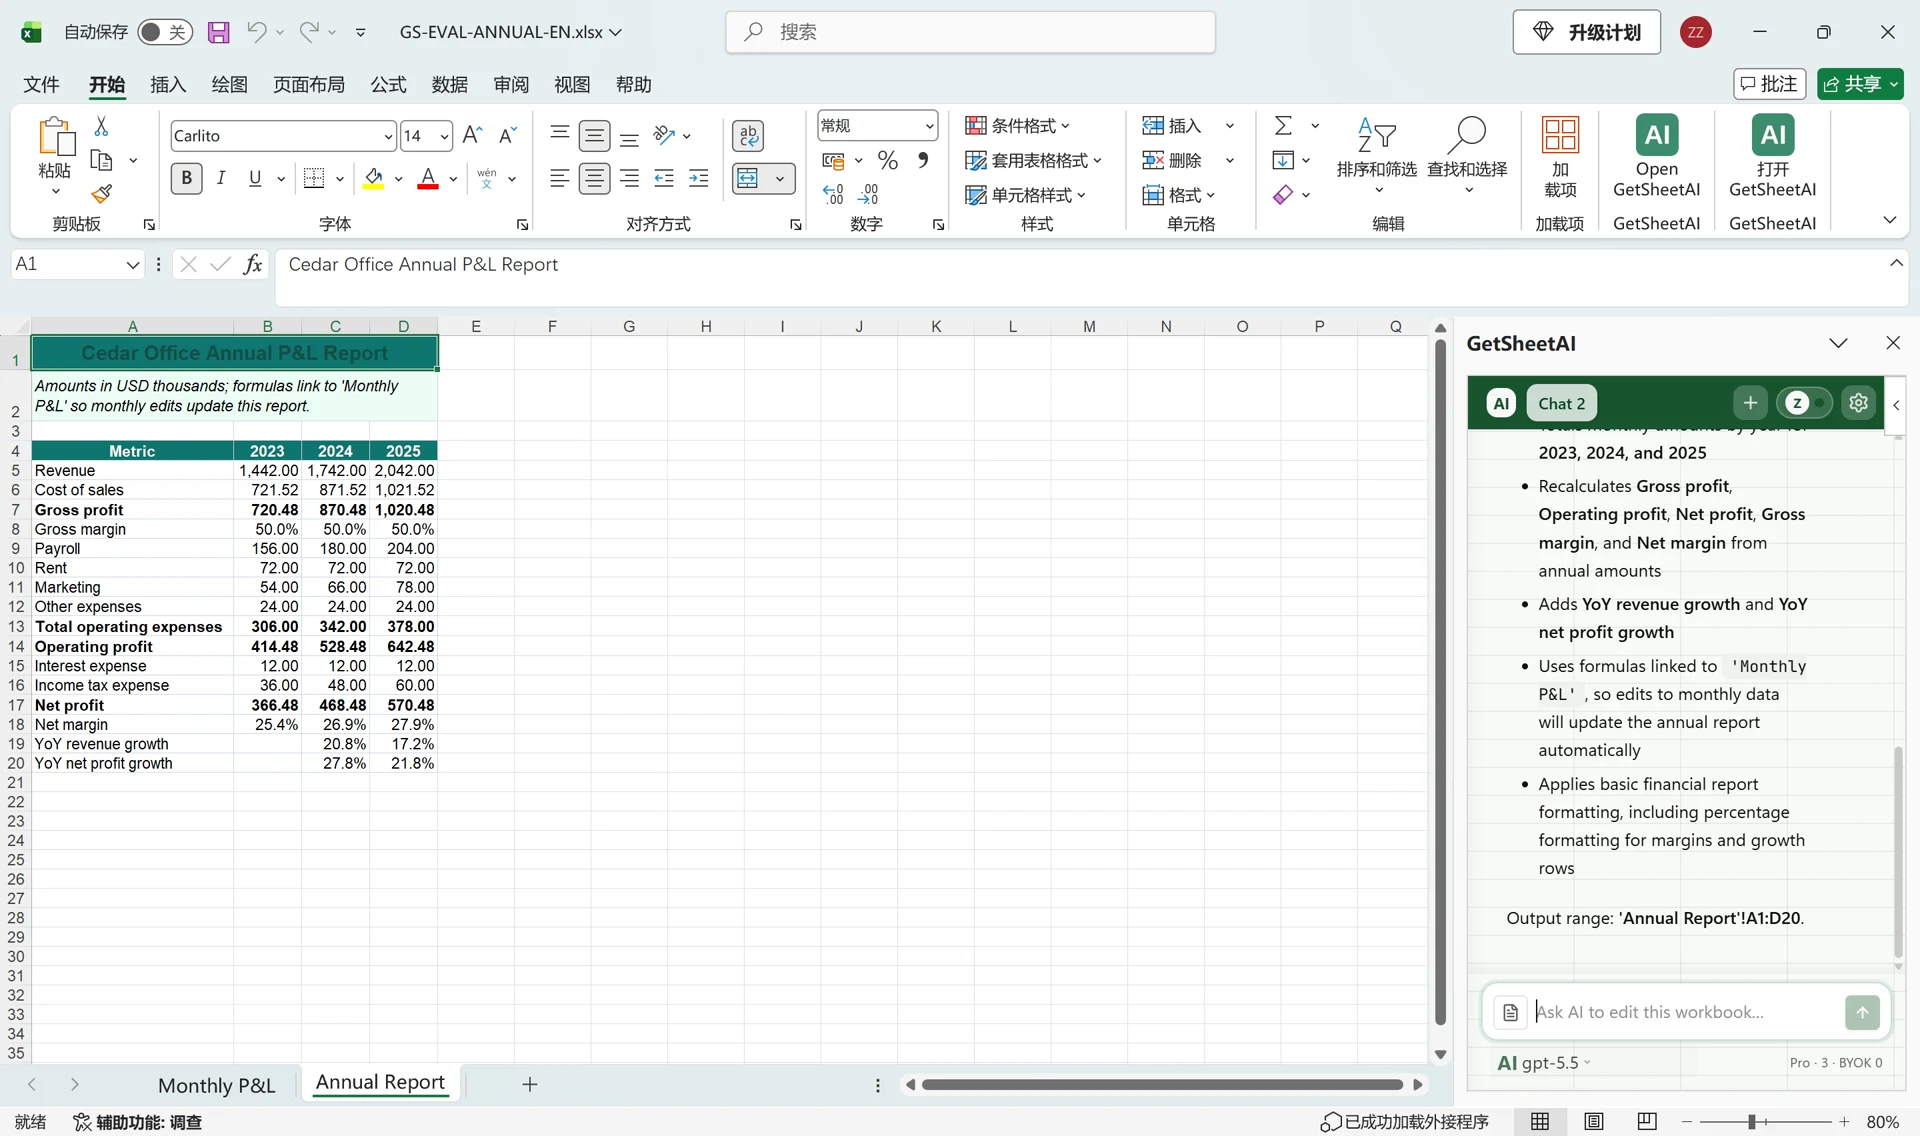
The result: three years side by side
The new Annual Report sheet summarizes 2023, 2024 and 2025. The original Monthly P&L sheet remains in place. All monetary amounts below are in USD thousands, matching the workbook. Percentages are displayed to one decimal place.
| Metric | 2023 | 2024 | 2025 |
|---|---|---|---|
| Revenue | 1,442.00 | 1,742.00 | 2,042.00 |
| Gross profit | 720.48 | 870.48 | 1,020.48 |
| Net profit | 366.48 | 468.48 | 570.48 |
| Net margin | 25.4% | 26.9% | 27.9% |
The time-saving part is not just the smaller table. The report retains formulas, so a later edit to an existing monthly value flows through without rebuilding the annual totals.
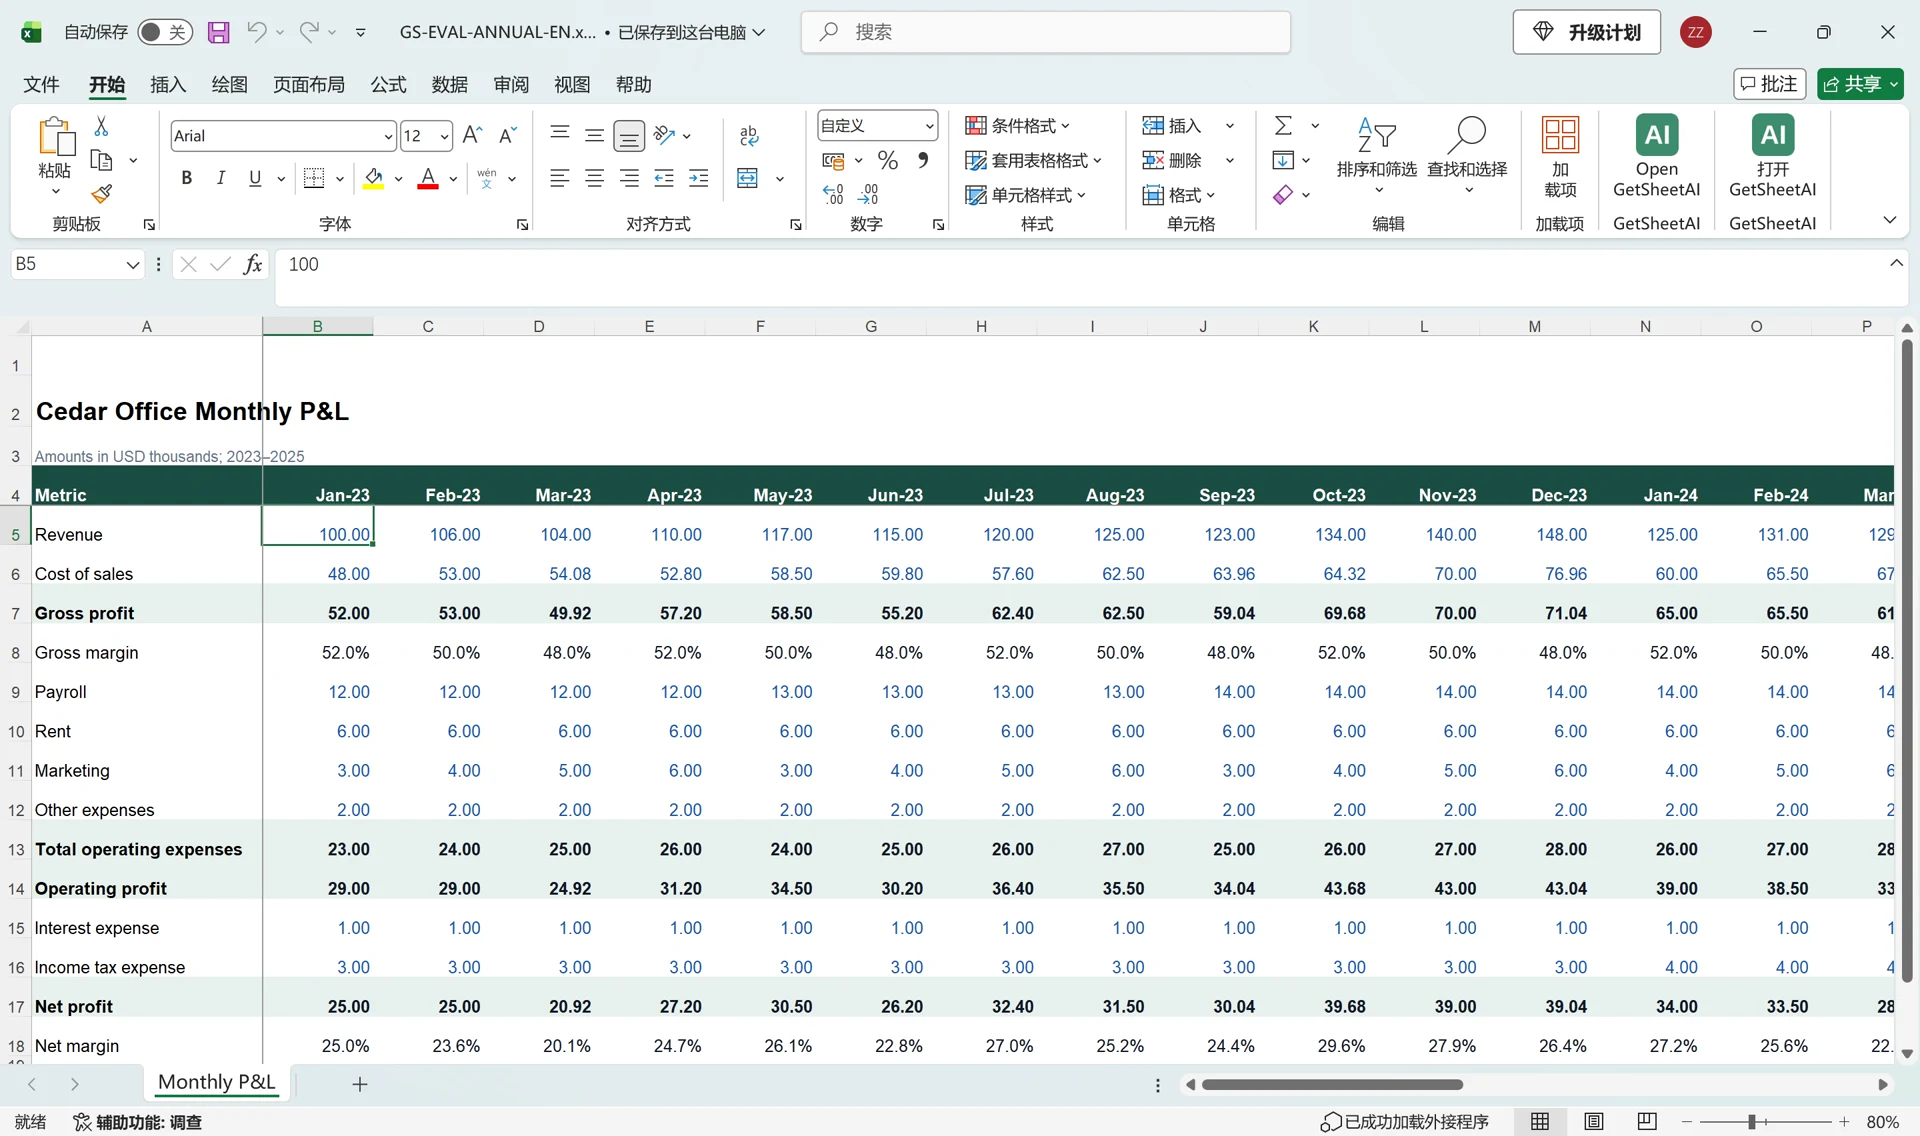
Start with the monthly table already in Excel
This is one sheet with 36 monthly columns, not 36 separate worksheets. Each column represents a month from January 2023 to December 2025. Rows contain revenue, cost of sales, payroll, rent, other expenses and profit measures.
The date headers are in B4:AK4; revenue is in B5:AK5. That structure lets a formula identify which columns belong to each year. No separate workbook upload was needed for this open-sheet workflow.
If your months arrive as separate files instead, start with the Excel file-merging case before building an annual summary.
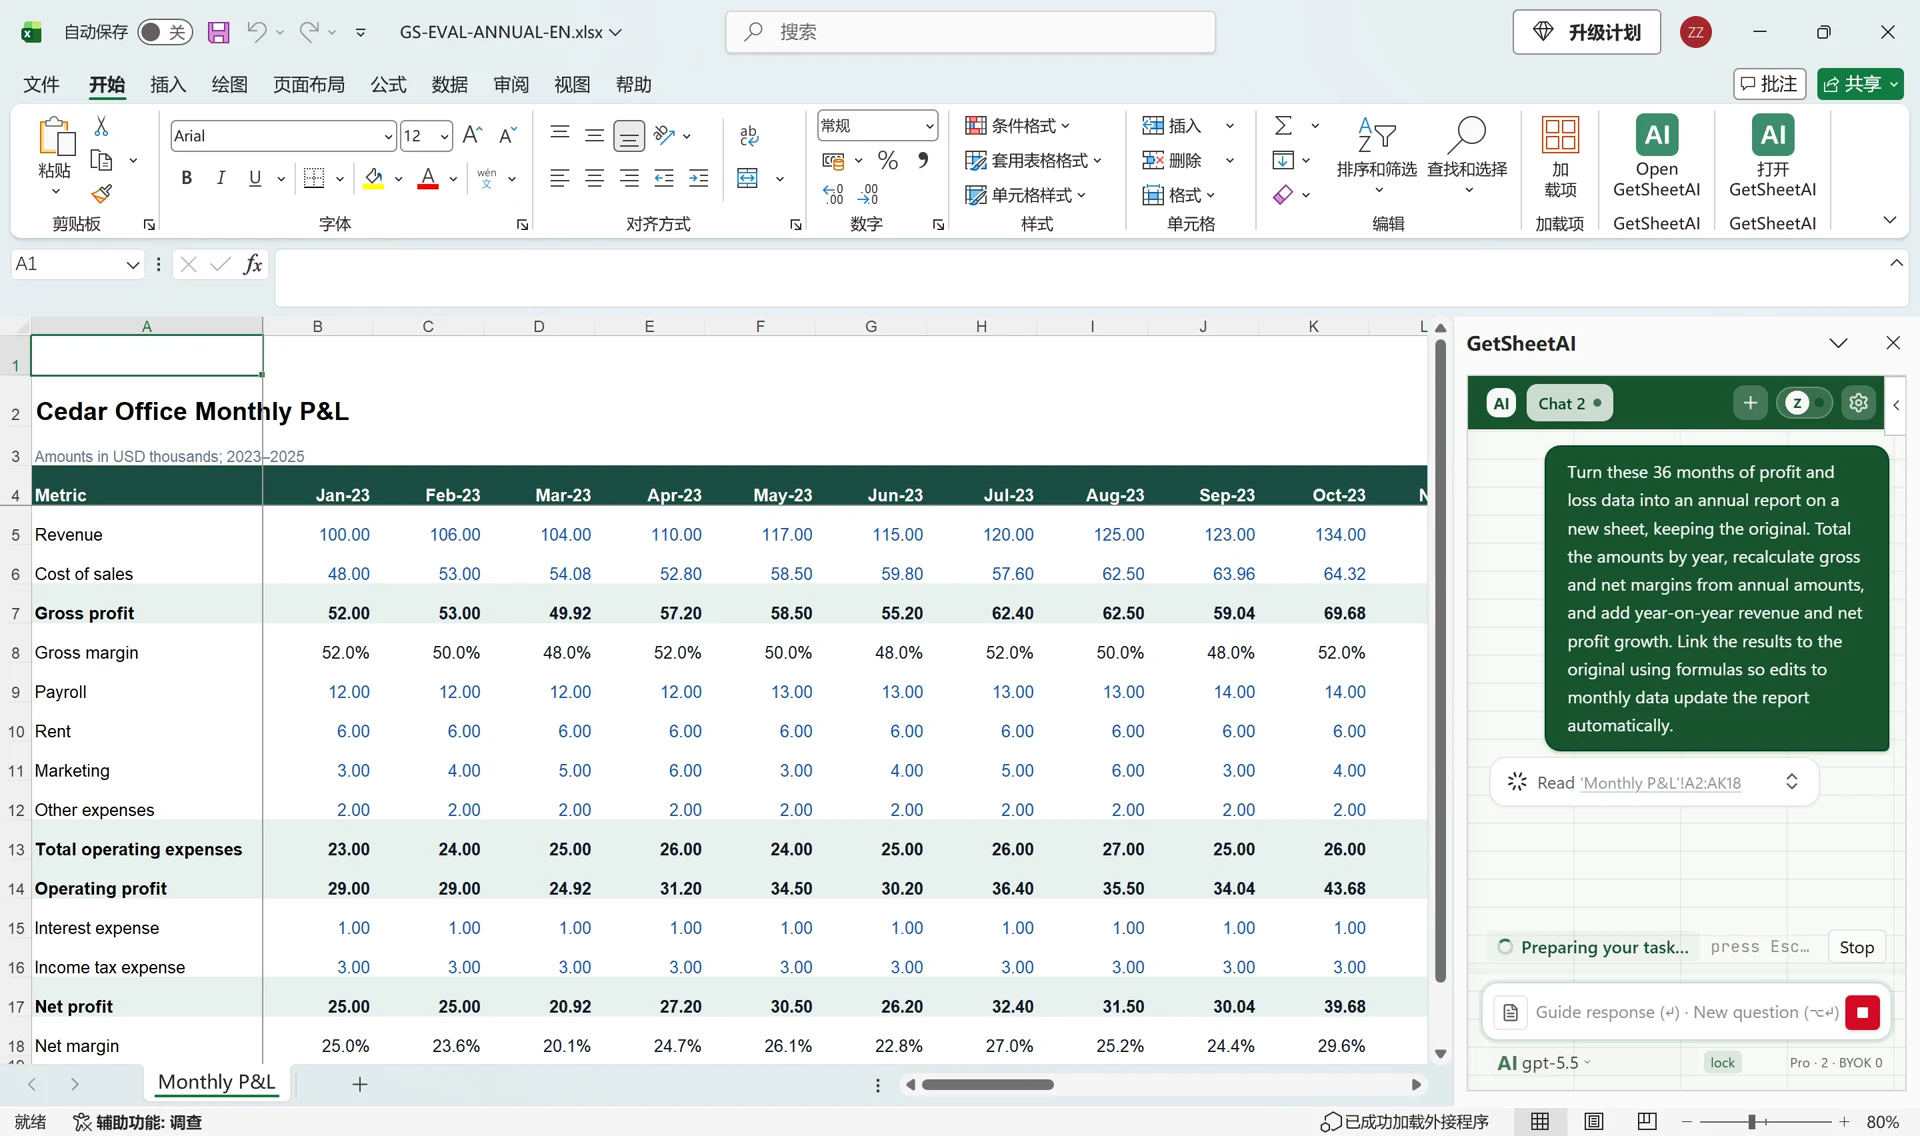
The exact instruction used in the recording
Open the GetSheetAI pane beside the source table and describe the report you want:
Turn these 36 months of profit and loss data into an annual report on a new sheet, keeping the original. Total the amounts by year, recalculate gross and net margins from annual amounts, and add year-on-year revenue and net profit growth. Link the results to the original using formulas so edits to monthly data update the report automatically.
This request specifies the destination, calculation rules and future behavior in ordinary language. You do not need to write the formulas first or move the result back from a chat window.
Why annual margins are calculated differently
Amounts and percentages need different treatment. Revenue and expenses are totaled for the year. Annual gross margin is annual gross profit ÷ annual revenue; annual net margin is annual net profit ÷ annual revenue.
Adding monthly percentages would not give an annual margin. An unweighted average can also be misleading when monthly revenue varies. Using annual amounts gives the ratio for the year as a whole.
Year-on-year growth compares the current year with the previous one: current year ÷ previous year − 1. The first year has no prior-year data in this workbook, so its growth cells are blank rather than presented as zero growth.
The formula stays in the worksheet
For 2023 revenue, the recorded result uses this formula in Annual Report!B5:
=SUMPRODUCT(--(YEAR('Monthly P&L'!$B$4:$AK$4)=B$4),'Monthly P&L'!$B$5:$AK$5)
B4 on the report contains the year. The formula matches that year against the monthly date headers and adds the corresponding revenue values. Those headers must be real Excel dates; if yours are text, convert text to dates first.
This is the formula from the English workbook. Function names and separators can differ in localized Excel versions. Adapt the sheet names and ranges to your own layout rather than pasting the example unchanged.
Change one monthly value; the annual report updates
In the recorded demonstration, we changed January 2025 revenue from 150 to 200 on the source sheet. Annual revenue changed from 2,042 to 2,092. Net profit and the related percentages also recalculated. We then restored the original input.
The completed case checks confirmed the initial totals, the changed totals and the restored totals. Creating the report left the original source data unchanged; the later input edit was a deliberate demonstration of formula linkage.
Changes inside the referenced range recalculate through Excel. Adding a 37th month outside B:AK is a different task—the formulas need an extended range or a suitable dynamic structure. This demonstration does not claim that a fixed range automatically expands.
Try the workflow on your own report
Install the add-in through the Microsoft 365 option on the GetSheetAI installation page, open the monthly workbook and ask for the annual view. Mention that the source should stay in place and that the result should remain formula-linked.
For an introduction, see AI for Excel: cleaning, formulas and reports. If your next step is a written narrative, see the Excel-to-Word report case.