Calculate Weighted Grades and Rankings for 3,000 Students in Excel with AI
A real GetSheetAI Excel demo: match three grade sheets by student ID, apply 20/30/50 weighting, calculate class and year ranks, and label missing exams.
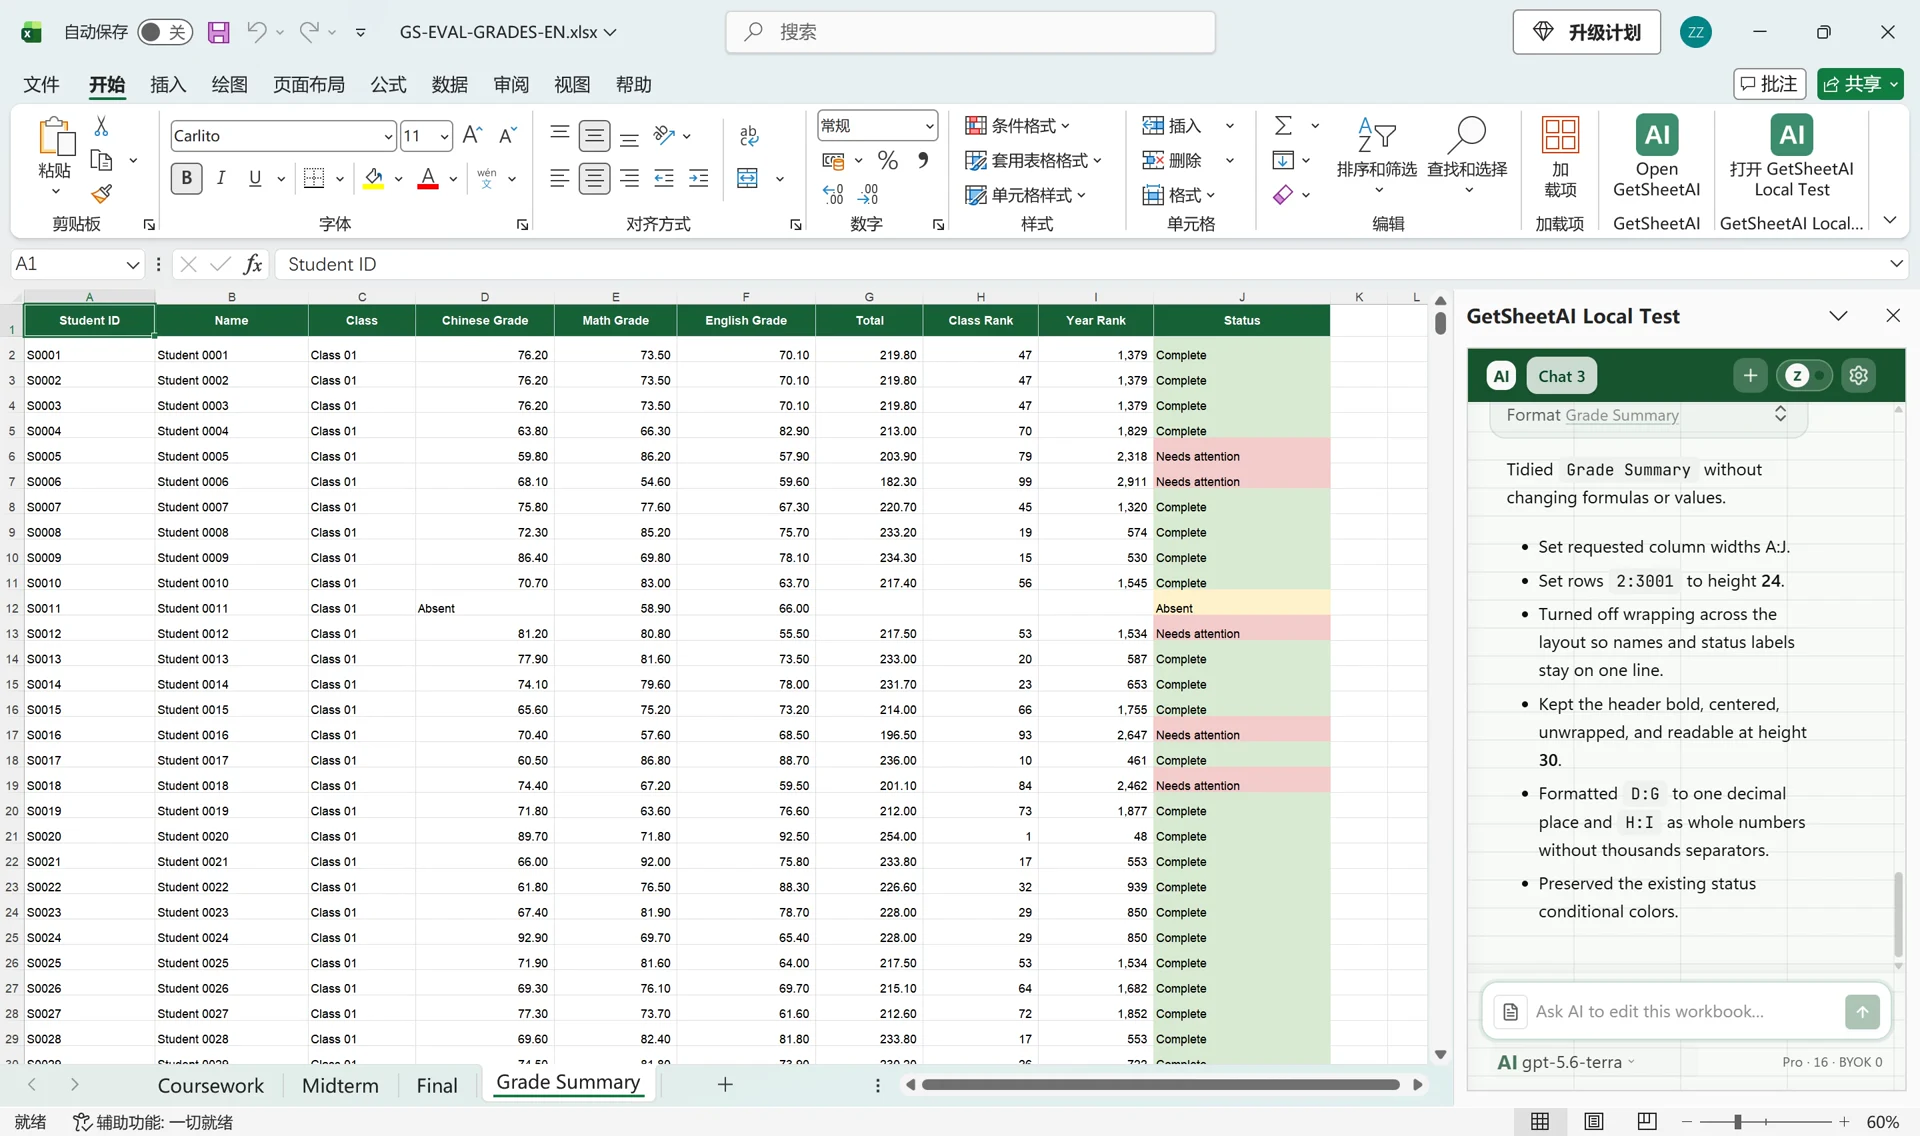
Real screenshots from a local developer demo using simulated data, not customer records. The original app interface is preserved. Short videos include sped-up processing.
▶ Watch the short demo on YouTubeThree grade files. Three thousand students. And the rows are not in the same order.
Before calculating anything, those records need to meet on Student ID. This demo uses GetSheetAI to build a Grade Summary sheet with subject grades, totals, class ranks, year ranks and color-coded status labels—all inside Excel.
Start with the grading rules
The three source sheets are Coursework, Midterm and Final, covering Chinese, Math and English. The workbook already contains the same complete source data as the attached files, so the request explicitly says not to import it again.
Each subject uses 20% coursework, 30% midterm and 50% final, rounded to one decimal. The three subject grades make the total. Rankings descend by numeric total and use competition ranking: tied students share a rank and the next position is skipped.
A missing exam makes that subject “Absent”; the total and both ranks remain blank. Otherwise, any subject below 60 produces “Needs attention”; the remaining rows are “Complete”. These are the demo’s stated rules, not a universal grading policy.
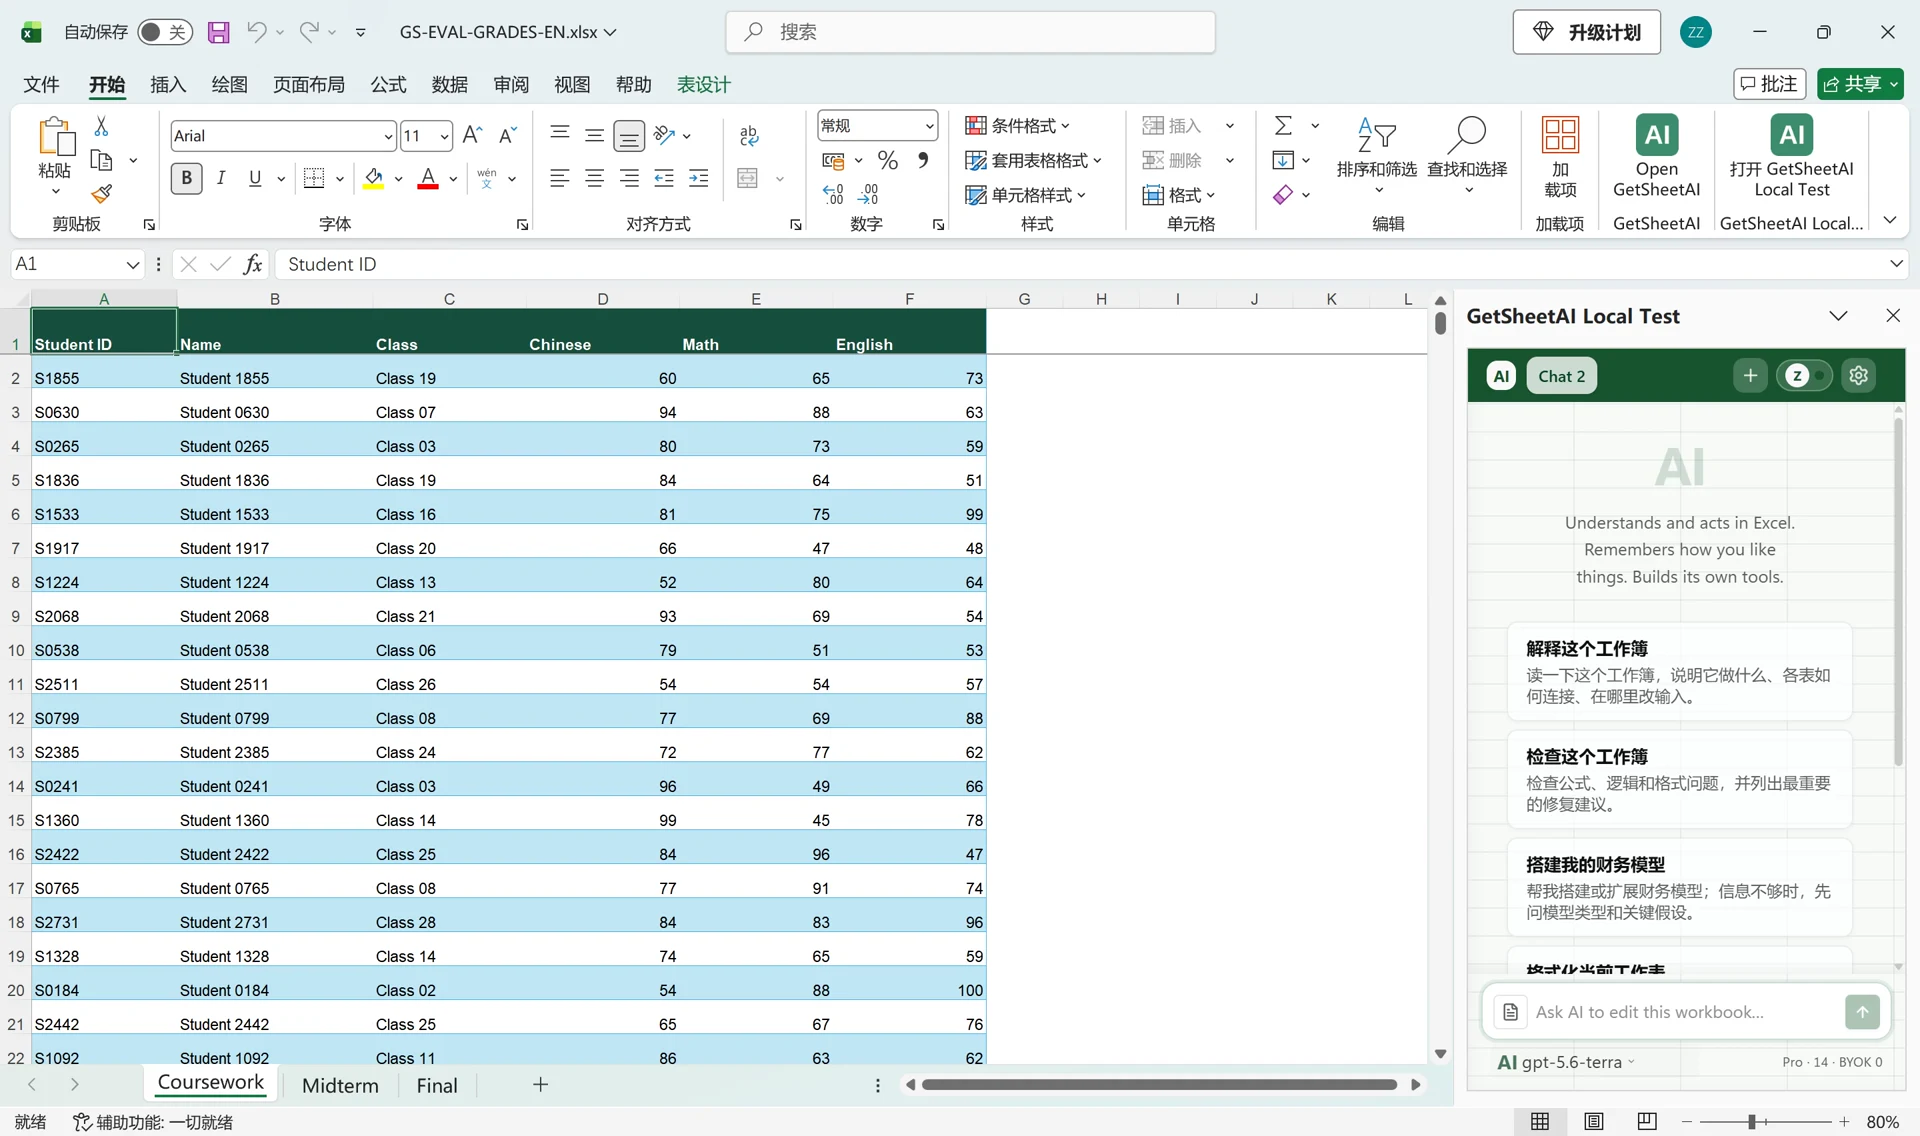
The instructions used in the demo
The first request specifies matching, weights, missing-exam handling and ranking. A separate follow-up asks for a tidier layout without changing formulas or values. Both are preserved below.
The active workbook already contains all three complete source sheets, identical to the uploaded files; do not import them again. Match the three uploaded grade files by Student ID and summarize all 3,000 students in Grade Summary. For each subject, weight Coursework 20%, Midterm 30%, and Final 50%, rounded to one decimal; calculate the three-subject Total, Class Rank, and Year Rank. Only rows whose Total is numeric may be counted in either ranking; ignore blanks and text totals. Use descending competition ranks (ties share a rank and skip the next). An Absent entry makes that subject grade Absent; leave Total and both ranks blank and exclude incomplete students from ranking. Status is Absent for missing exams, Needs attention if any subject grade is below 60, otherwise Complete; color the status cells pale yellow, pale red, and pale green respectively. Columns: Student ID, Name, Class, Chinese Grade, Math Grade, English Grade, Total, Class Rank, Year Rank, Status. Sort by Student ID and keep source sheets unchanged.
Please tidy the Grade Summary layout without changing any formulas or values. Names and status labels should fit on one line. Use column widths A=17, B=20, C=14, D=18, E=16, F=18, G=14, H=15, I=15, J=23; set rows 2:3001 to height 24, turn off text wrapping, and keep the header readable. Show D:G to one decimal and H:I as whole numbers without thousands separators. Keep all status colors.
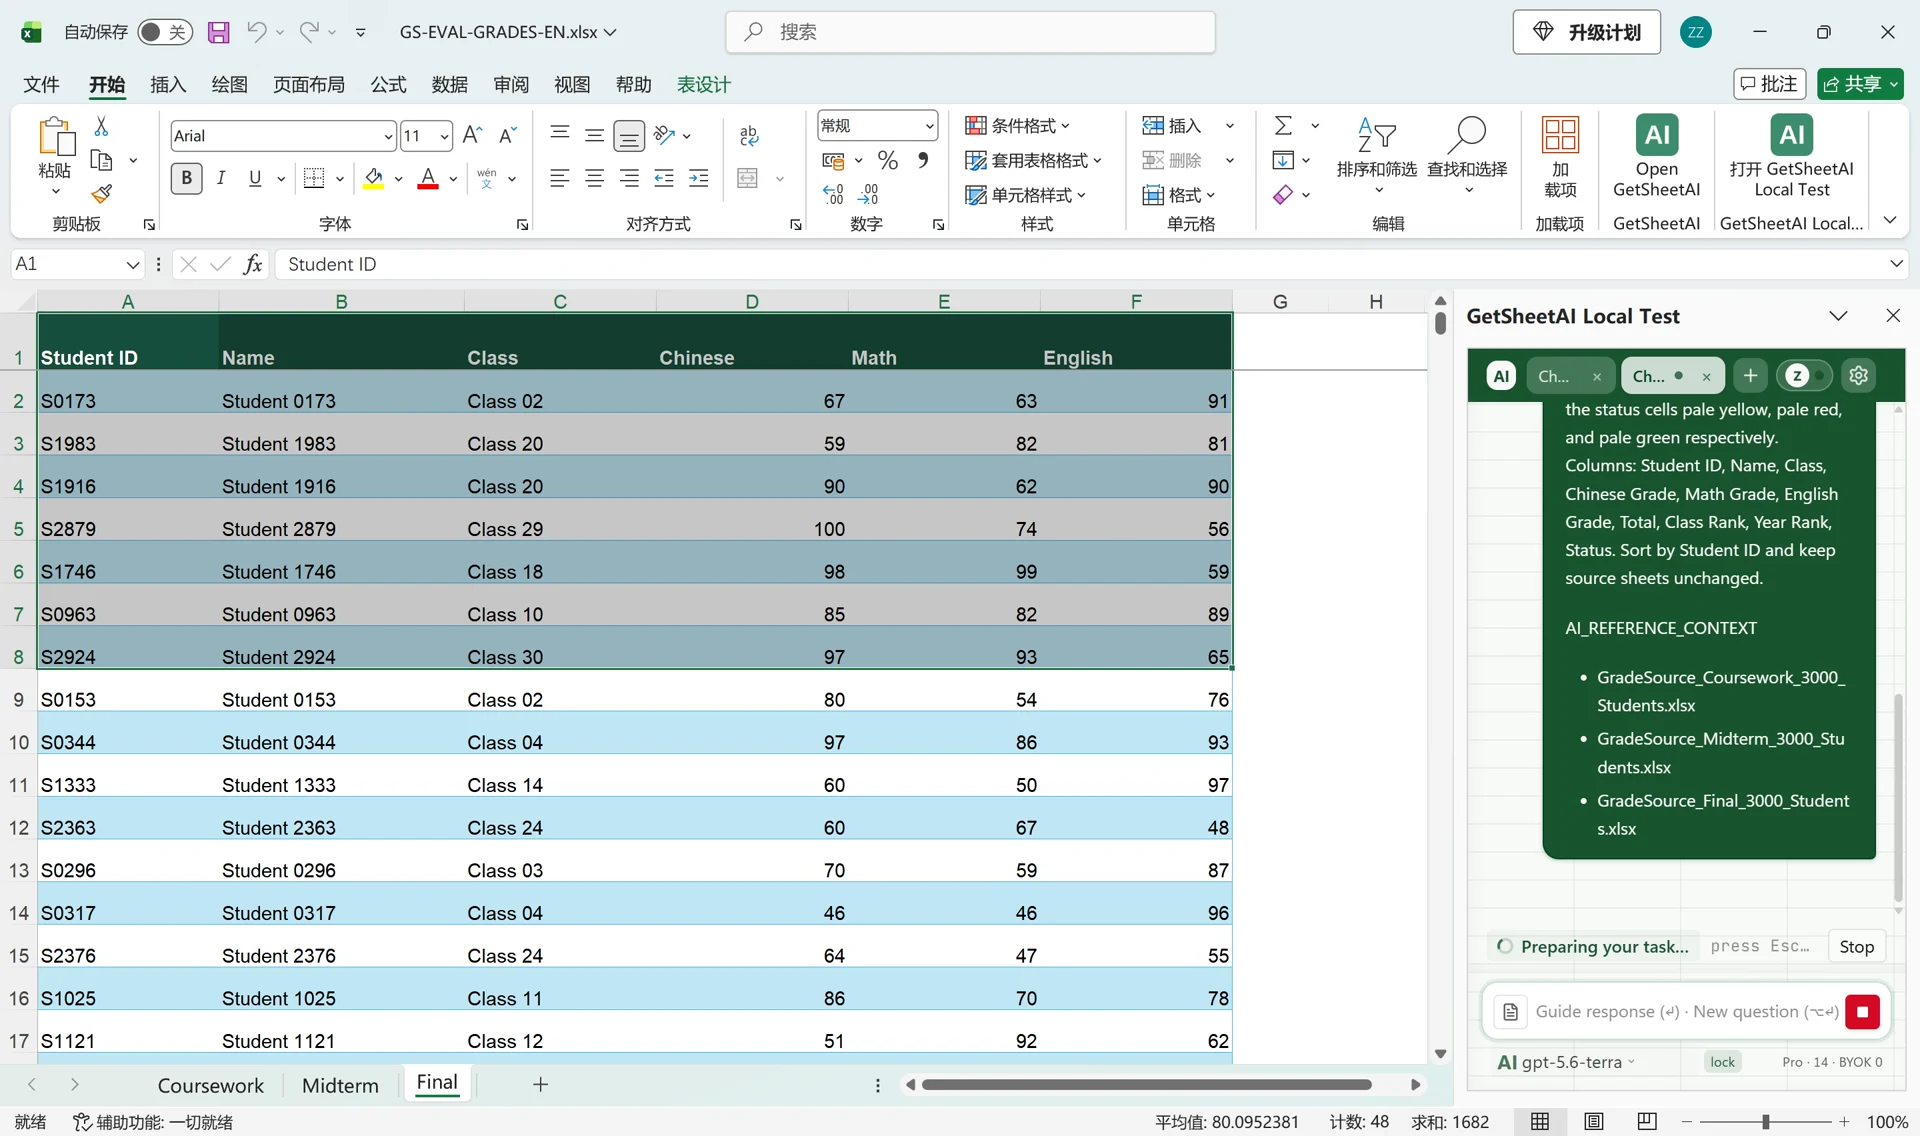
One summary instead of three separate lists
The completed summary contains all 3,000 students, sorted by Student ID: 2,079 marked Complete, 903 Needs attention and 18 Absent. Incomplete students are excluded from both rankings rather than being treated as zero-scoring students.
The three source sheets remain unchanged. The output brings names, classes, three subject grades, total, both ranks and status into ten columns. Color-coded status cells make the different groups easy to find.
Adapt the request to your gradebook
Replace the subject names, weights, missing-exam policy and ranking rules with the ones your institution uses. State whether rankings are within a class or across the year, and what ties should mean, before asking for the summary.
The practical benefit is less manual matching, formula filling and report formatting. The recording is a local developer demonstration with simulated student records, not a customer deployment. It also includes a layout follow-up; it is not presented as a one-prompt or 31-second processing claim.