Excel Inventory Replenishment: Build a Live Reorder Report with AI
A 600-item Excel case: calculate stock coverage and full-case reorder quantities, include inbound stock, flag exceptions and keep the report updating.
Real screenshots from a local developer demo using simulated data, not customer records. The original app interface is preserved. Short videos include sped-up processing.
▶ Watch the short demo on YouTubeWhich products need replenishing, and how many units should you order? A stock list alone cannot answer both questions. It needs recent usage, delivery lead times, inbound quantities and the supplier's case size.
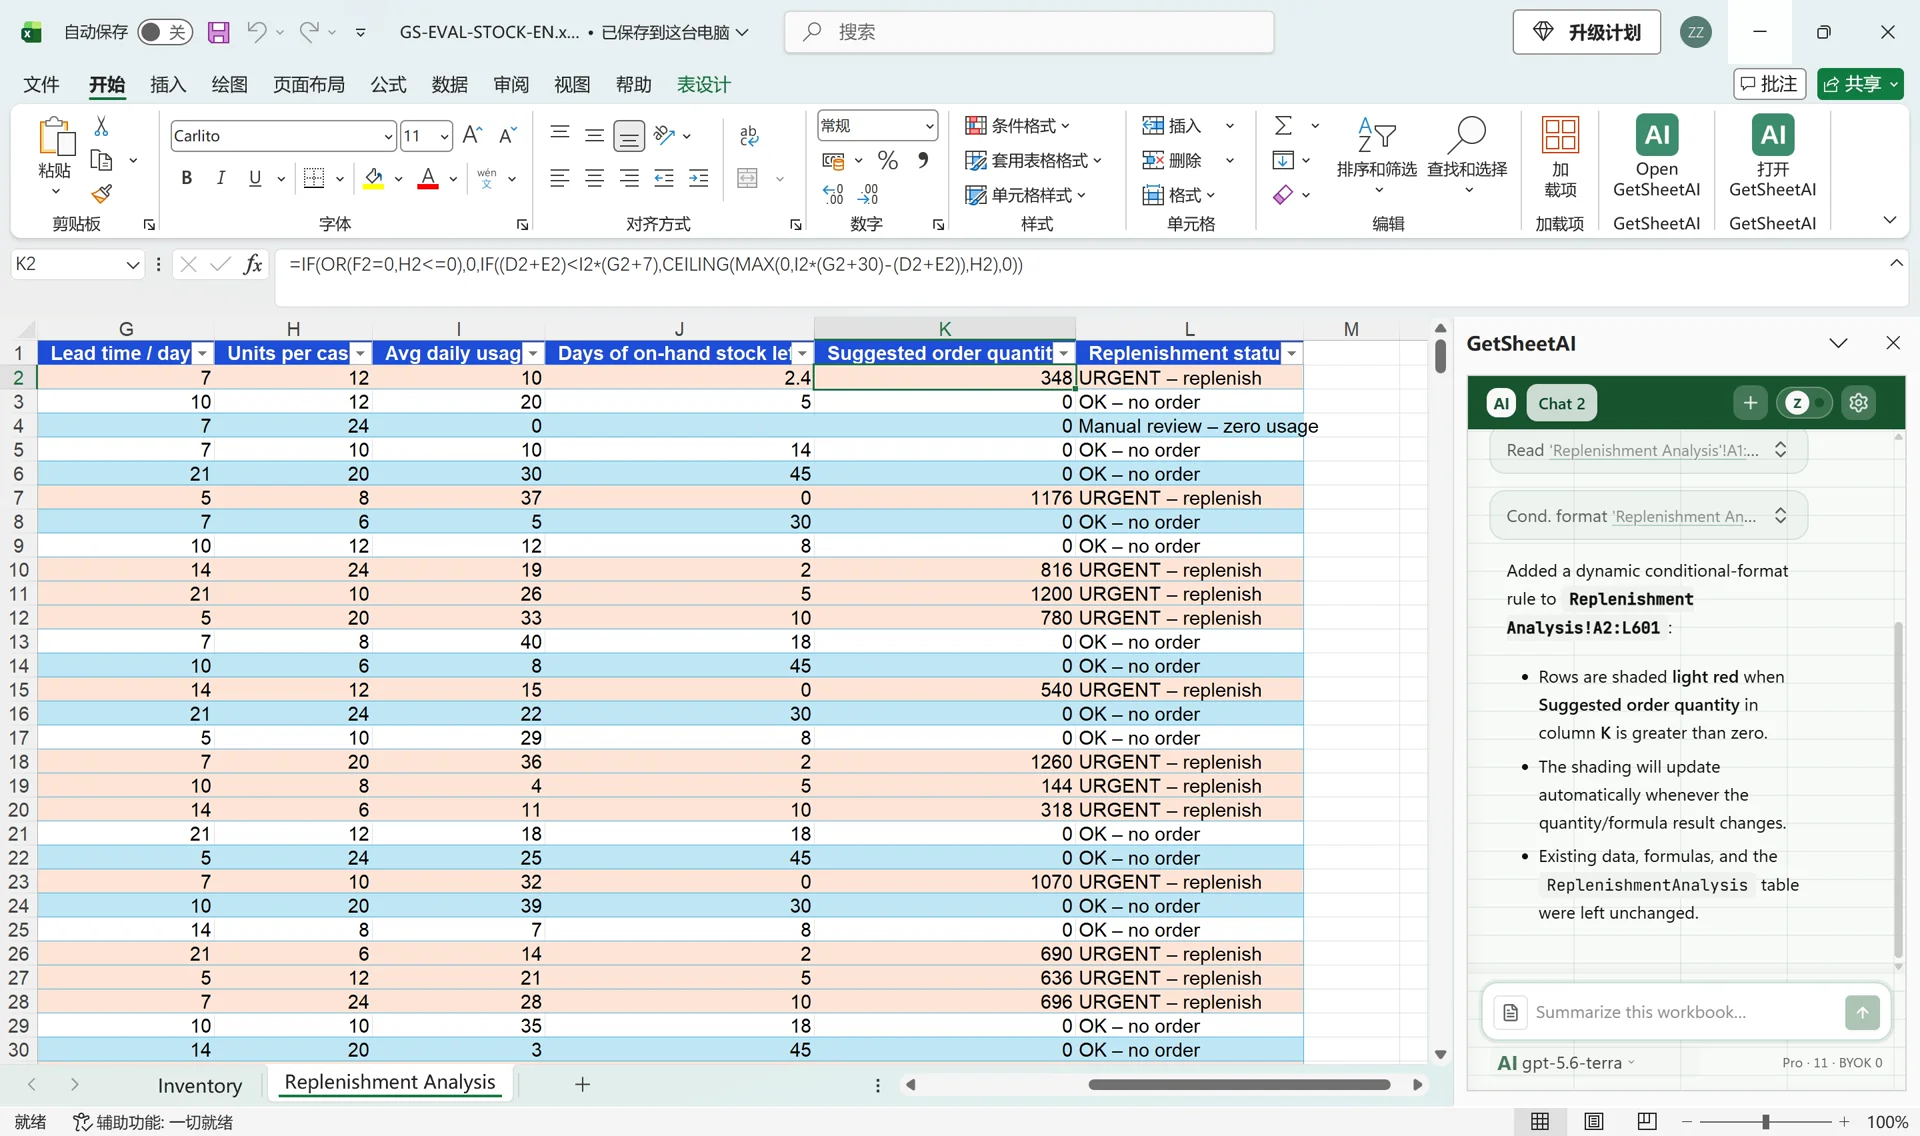
An Excel replenishment report combines those inputs into a reorder rule, then keeps the calculations linked to the source. In this GetSheetAI developer demonstration, 600 simulated product records became a filterable report with visible shortage warnings and formula-based order quantities.
Start with the result
The report shows daily usage, days of stock remaining, suggested order quantity and a review status. When we increased the first product's on-hand stock by 500 units, its suggested order changed from 348 to 0. Restoring the source value restored the suggestion to 348.
That is the useful difference between a screenshot of an analysis and a workbook you can keep using. The recorded English run took about 166 seconds; the short video speeds up waiting. This is one observed run, not a processing-time guarantee.
Prepare six inputs per product
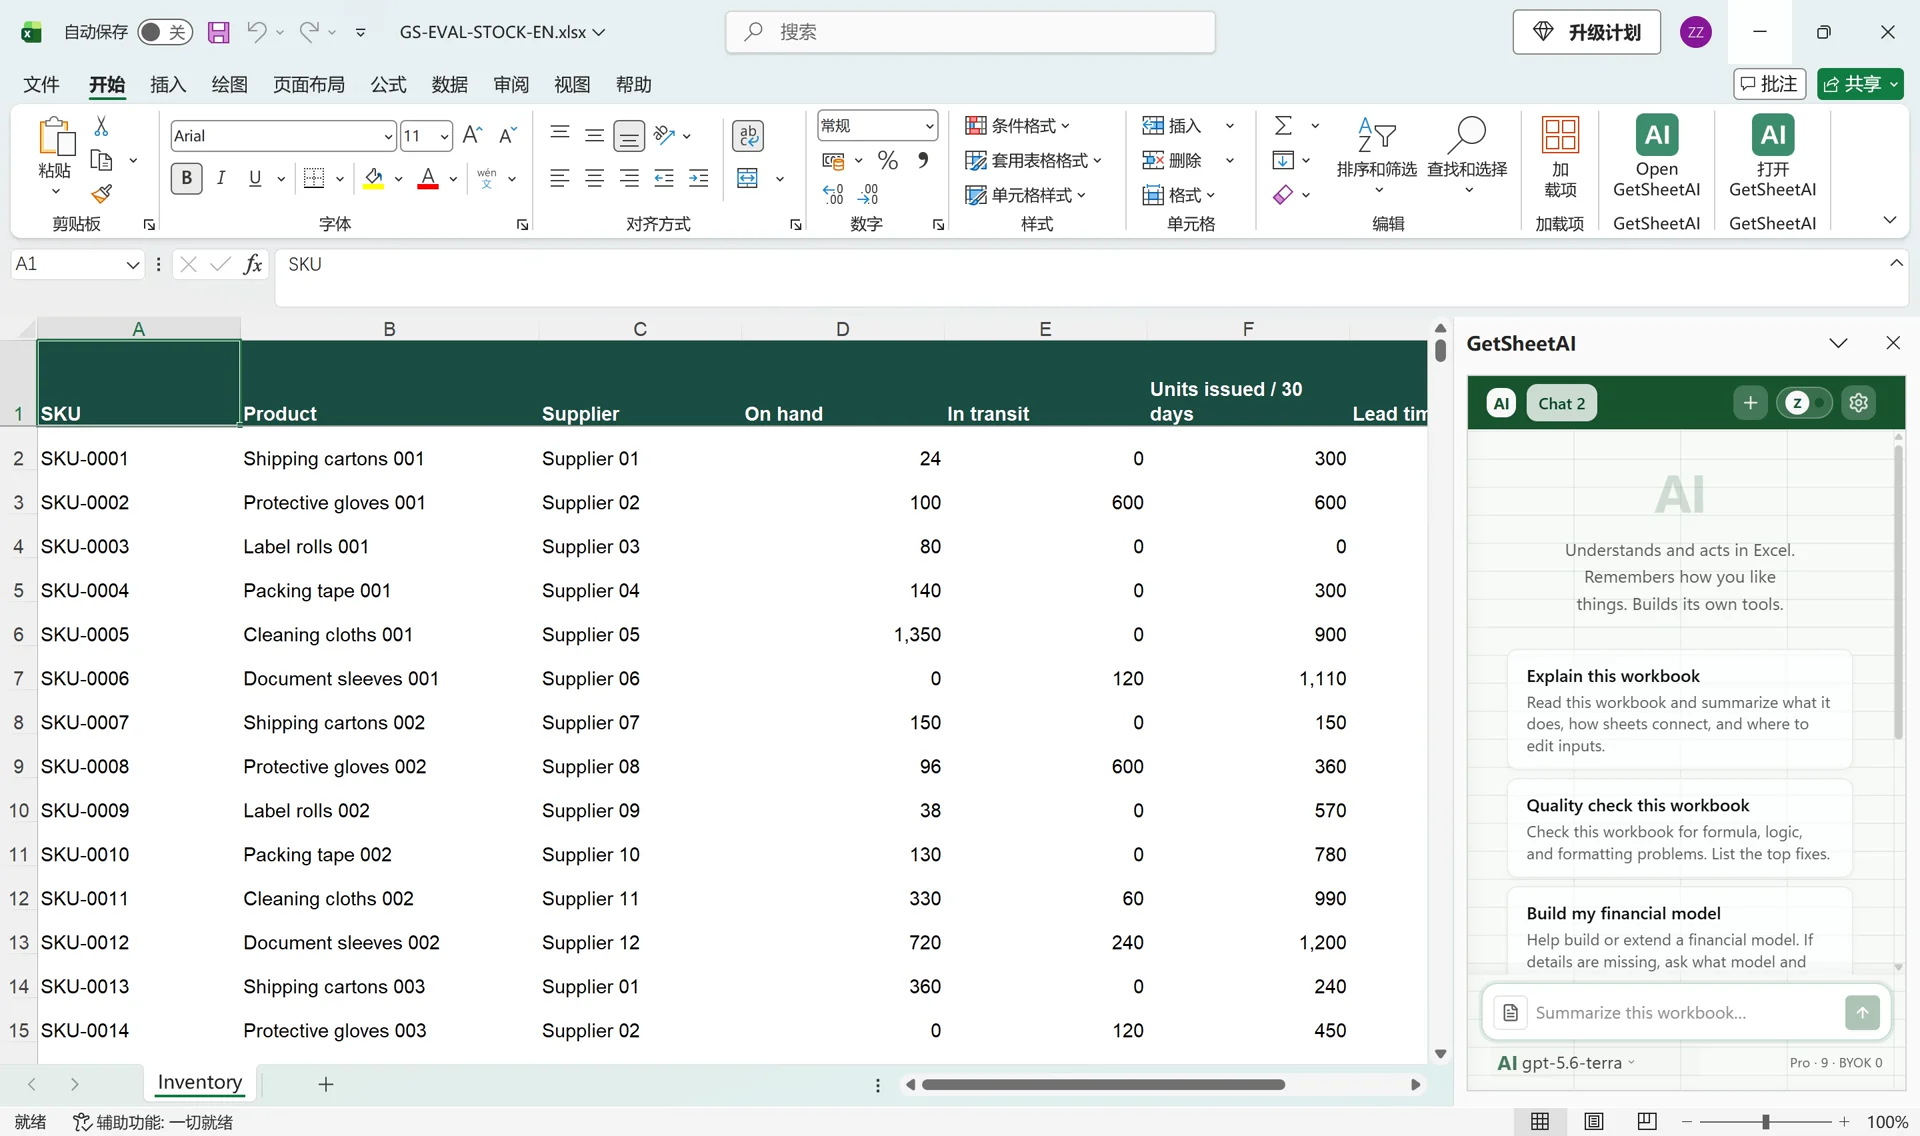
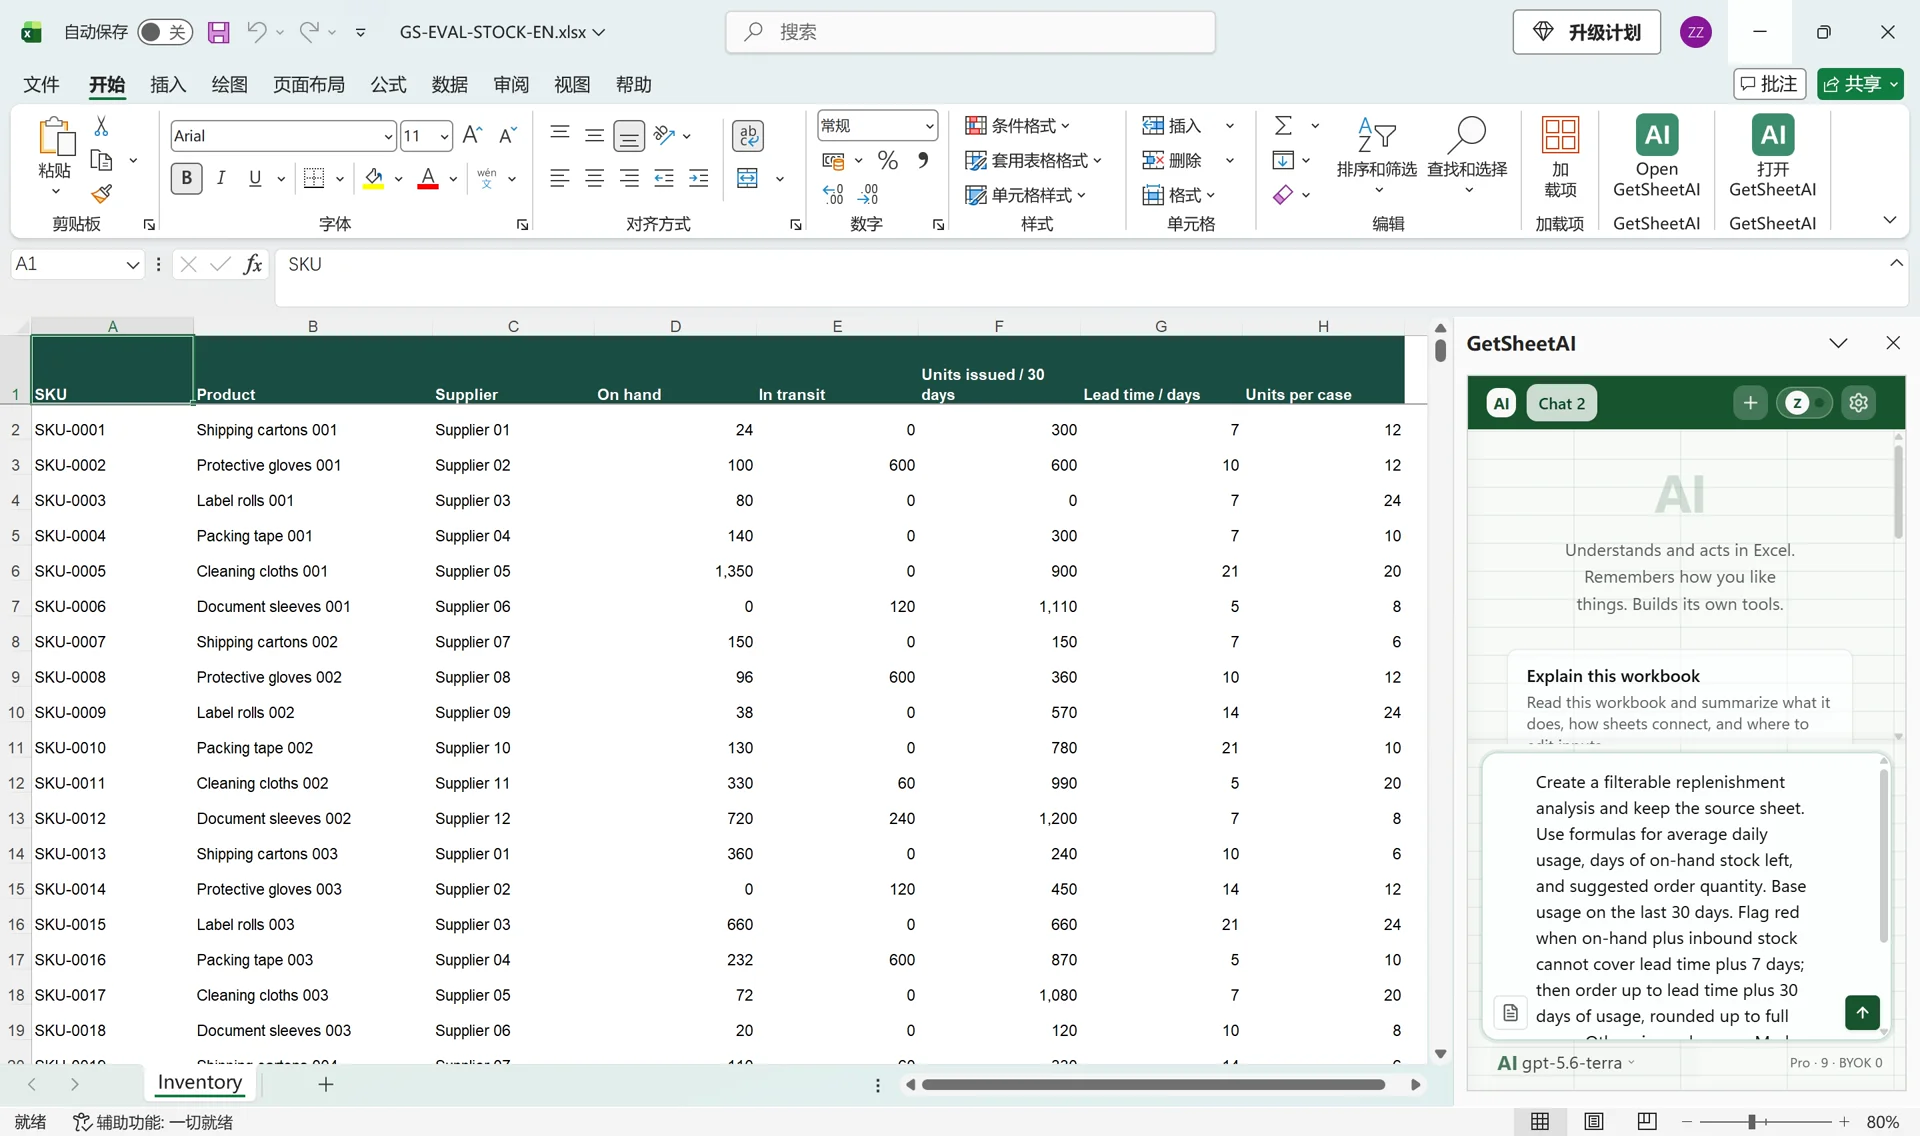
Keep a stable product ID alongside on-hand stock, inbound quantity, usage over the last 30 days, supplier lead time in days and units per case. Give each column a clear unit. A case of 12 units is different from an order quantity of 12 cases.
This example assumes the inbound stock arrives in time to help cover demand. If delivery dates differ, include expected arrival dates and use a time-phased plan. A positive inbound total alone does not prove that tomorrow's shortage is covered.
Ask GetSheetAI to build the report
Open the workbook, open GetSheetAI inside Excel and start a new conversation. The current workbook is already available; you do not need to upload the same file again. An adaptable request is:
Create a filterable replenishment report on a new sheet. Use the last 30 days of usage to calculate daily usage and days of on-hand stock remaining. If on-hand plus inbound stock cannot cover lead time plus 7 days, flag the item and suggest enough units to reach lead time plus 30 days, rounded up to full cases. Show zero-usage items for manual review. Keep the source unchanged and use formulas that update when stock changes.
The numbers 7 and 30 are this example's planning settings. Replace them with your own policy before using the result for purchasing.
The calculations behind the suggestion
| Calculation | Rule used in the case |
|---|---|
| Daily usage | Last 30 days of usage divided by 30 |
| On-hand coverage | On-hand stock divided by daily usage |
| Available quantity | On-hand plus inbound units |
| Reorder trigger | Available quantity below daily usage × (lead time + 7) |
| Target quantity | Daily usage × (lead time + 30) |
| Suggested units | Positive target shortfall, rounded up to a whole case, only when the trigger is met |
For example, suppose daily usage is 10 units, lead time is 14 days, available stock is 150 units and a case contains 12 units. The trigger is 210 units, so replenishment is needed. The target is 440; the shortfall of 290 rounds up to 300 units, or 25 cases. This small arithmetic example explains the rule; it is separate from the recorded 348-unit product.
Zero usage needs a separate branch rather than division by zero or an invented demand estimate. Missing or nonpositive case sizes also need review before rounding.
Verify one change before reusing the workbook
The recorded checks covered all 600 daily-usage, coverage and suggested-quantity calculations, the filterable result table, conditional formatting and source preservation. Zero-usage items remained review items. The stock-change check confirmed that both the result and its formulas stayed useful after an edit.
For your own file, check an urgent item, an item with inbound stock, a zero-usage item and a case-rounding boundary. Confirm that new rows are included before treating an expanded dataset as covered by the original report.
Common questions
Does this automatically place purchase orders?
No. It creates a reviewable Excel planning report. Order approval and supplier communication remain separate actions.
Is a 30-day average a demand forecast?
It is a simple historical rate. Seasonal demand, promotions and unusual outages require additional rules or a different forecast. Keep the assumptions visible next to the report.
What should I do with inconsistent source data?
Start with the Excel data-cleaning checklist. If stock comes from several files, see the multiple-file merge case before calculating replenishment.